Summarize annual sex-and-age-specific survival rates from the census information
summarize_survival_from_census.RdThe prekill census in year t+1 is the post-kill census in year t, so we can use the prekill census to record the realized fraction of individuals of each age and sex that survived the death episode in each year. In the output survival in year t is the fraction of j-year olds in year t that survive to be j+1 year-olds in year t+1.
summarize_survival_from_census(
  census,
  fem_surv_probs = NULL,
  male_surv_probs = NULL,
  nbins = 10
)
Arguments
- census
a tibble of census counts with columns
yearandage, and then the counts of the different sexes in columns namedmale, andfemale.- fem_surv_probs
a vector of the parameters used for the simulation. If present these are put on the histogram plots. If you provide one of these, you have to provide both.
- male_surv_probs
a vector of the parameters used for the simulation. If present these are put on the histogram plots.
- nbins
number of bins for the histograms
Value
A list with components:
survival_tibble: A tibble with the following columns:year: The yearpop: The population whose census is being countedage: The age of individualssex: The sex of individualsn: The number of individuals alive and present of sexsexand ageagein yearyearin poppop.cohort: The birth year of these individualssurv_fract: The fraction of the n individuals that survive to have ageage + 1in yearyear + 1.
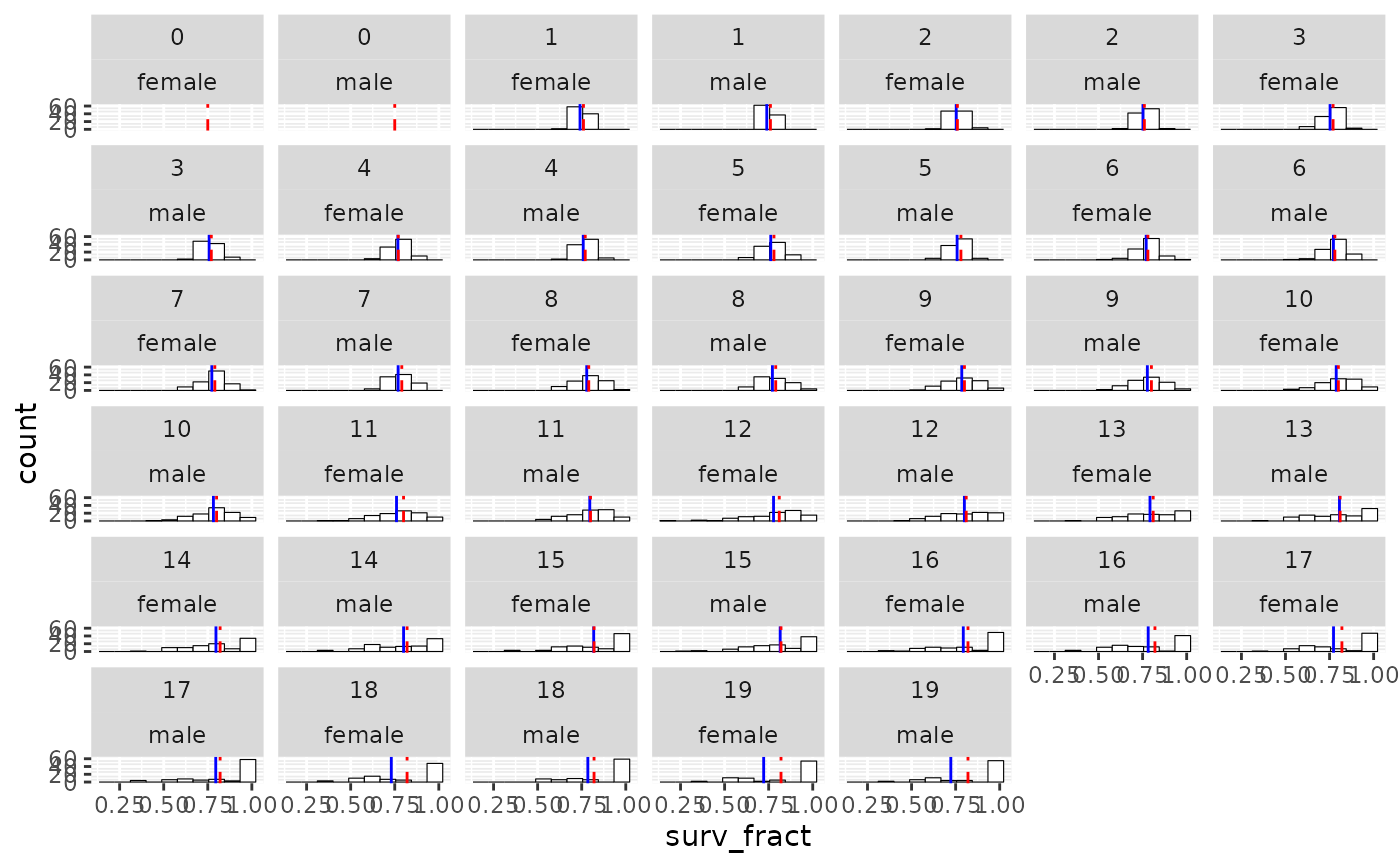
plot_histos_by_age_and_sex: A ggplot object of histograms of observed survival fractions facet-wrapped by age and sex. Blue vertical lines are the observed means and dashed vertical red lines are the expected values given the simulation parameters.
Details
This function does not track migrants. Another one is eventually in order that accounts for migrants out of the population. Also, the plots here might not play well with multiple populations.
Examples
result <- summarize_survival_from_census(
  species_1_slurped_results$census_prekill,
  species_1_life_history$`fem-surv-probs`,
  species_1_life_history$`male-surv-probs`
)

# print the results if you want
result$survival_tibble
#> # A tibble: 4,000 × 7
#>     year   pop   age sex        n cohort surv_fract
#>    <int> <int> <int> <chr>  <int>  <int>      <dbl>
#>  1    20     0    20 female     1      0      0
#>  2    20     0    19 female     2      1      1
#>  3    21     0    20 female     2      1      0
#>  4    20     0    18 female     2      2      0.5
#>  5    21     0    19 female     1      2      1
#>  6    22     0    20 female     1      2      0
#>  7    20     0    17 female     3      3      0.667
#>  8    21     0    18 female     2      3      1
#>  9    22     0    19 female     2      3      1
#> 10    23     0    20 female     2      3      0
#> # ℹ 3,990 more rows
result$plot_histos_by_age_and_sex