plot the graph showing the connected components
plot_conn_comps.RdThis is a simple wrapper for some tidygraph/ggraph functions that will let you find the connected components of a graph in which the related pairs are connected by edges. It also makes a plot of them.
plot_conn_comps(Pairs)Arguments
- Pairs
the tibble that comes out of
compile_related_pairs(). For this function it must have, at least the columnsid_1,id_2, anddom_relat.
Value
This returns a list with two components:
conn_comps: a tibble with three columns:name: the name of the samplecluster: the index of the connected component the sample belongs tocluster_size: the number of samples belonging to that cluster
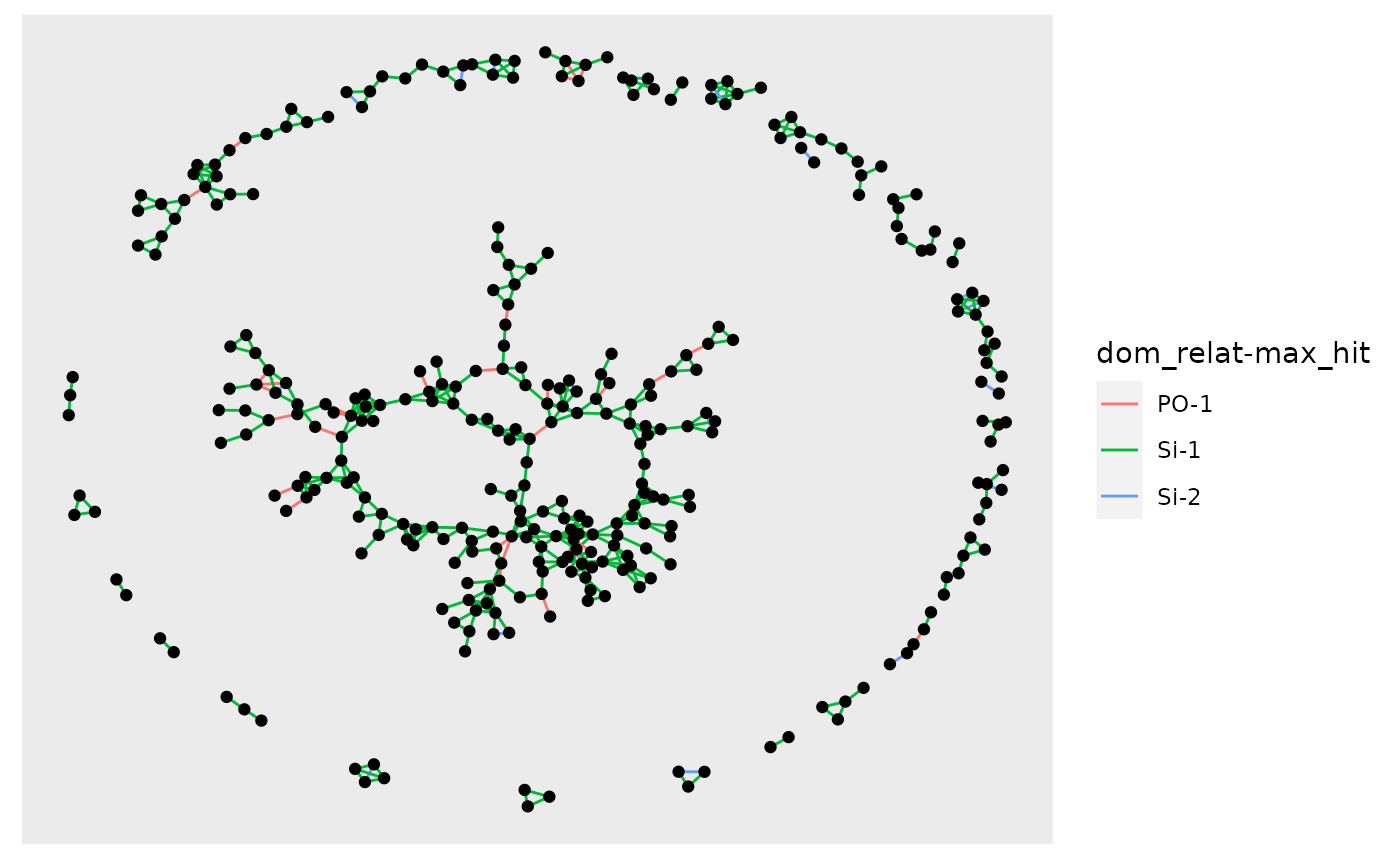
plot: a ggraph/ggplot plot object showing the connected components as vertices with edges between them.
Details
Note that it appears that the 'ggraph' package must be loaded for the plot output of this function to print correctly.
Examples
# get a Pairs tibble from the stored data
Pairs <- compile_related_pairs(species_1_slurped_results_1gen$samples)
PCC <-  plot_conn_comps(Pairs)

# look at the conn_comps:
head(PCC$conn_comps)
#> # A tibble: 6 × 3
#>   name     cluster cluster_size
#>   <chr>      <dbl>        <int>
#> 1 F48_0_28       1            3
#> 2 M49_0_55       1            3
#> 3 M49_0_56       1            3
#> 4 F48_0_4        2           23
#> 5 F49_0_49       2           23
#> 6 F50_0_17       2           23

# if you want to print the plot, that seems to require
# loading the ggraph library
library(ggraph)
#> Loading required package: ggplot2
PCC$plot