Count and plot the number of mates each individuals has produced offspring with
count_and_plot_mate_distribution.RdThis just tallies up the information from the pedigree. It will plot things faceted by pop (over rows) and sexes (over columns).
count_and_plot_mate_distribution(P)Arguments
- P
the pedigree from the simulation, like that returned in the
pedigreecomponent of the list returned byslurp_spip().
Value
A list with two components with names:
mate_counts: A tibble with information about the number of mates with which a parent produced offspring each year. It has the columns:sex: the sex of this parentyear: the year during which the mating occurredpop: the population this parent was inparent: the ID of the parentnum_offs: the number of offspring this parent had in totalnum_mates: the number of mates this parent had
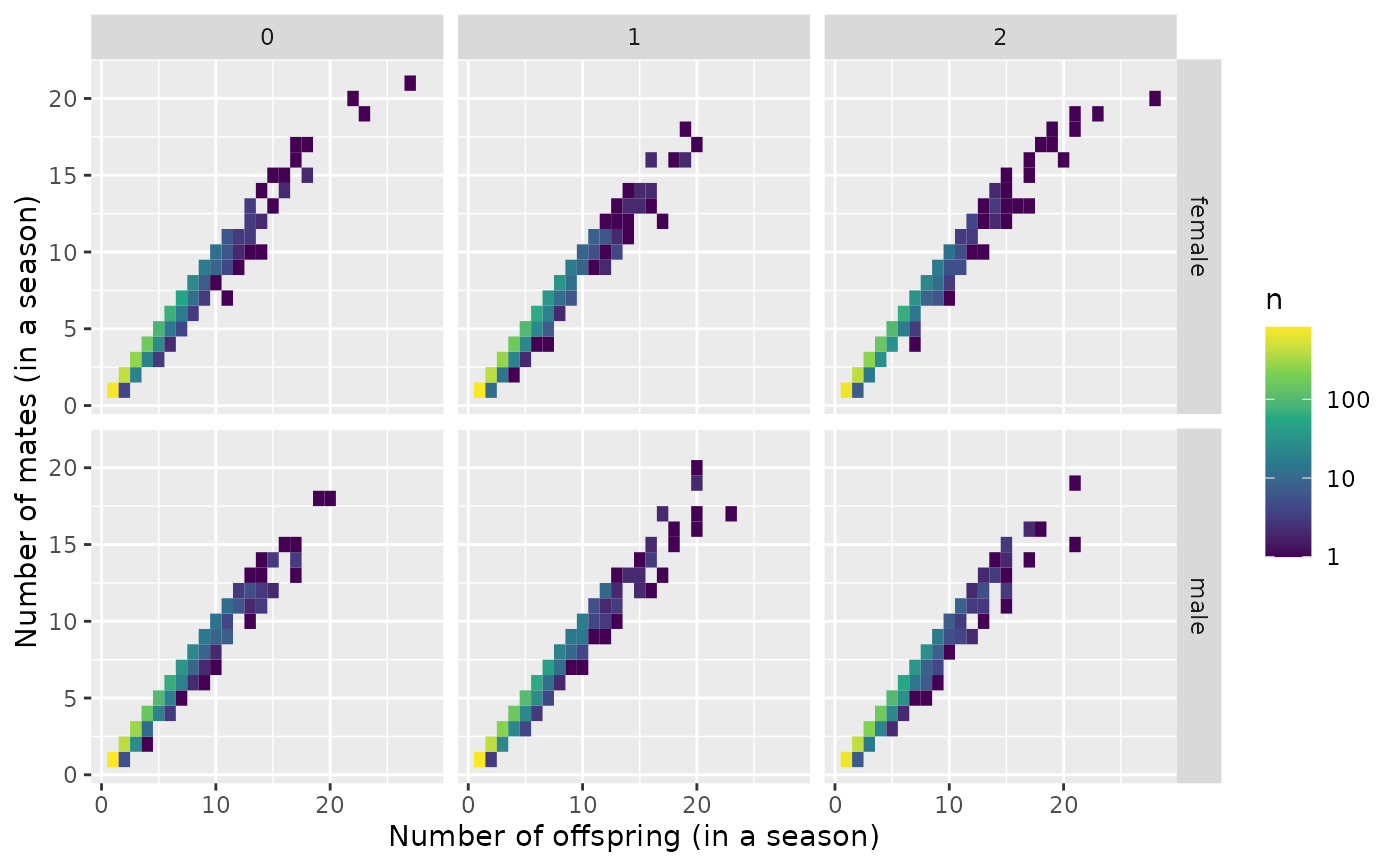
plot_mate_counts: a ggplot object, faceted on a grid by population in columns and sex in rows. The x-axis is the number of offspring (in a season), the y-axis is the number of mates in a season, and the fill color of the grid gives the number of parents with that number of offspring and mates.
Examples
result <- count_and_plot_mate_distribution(three_pops_no_mig_slurped_results$pedigree)

# have a look at the results:
result$mate_counts
#> # A tibble: 12,417 × 6
#>    sex     year   pop parent  num_offs num_mates
#>    <chr>  <int> <int> <chr>      <int>     <int>
#>  1 female     5     0 F0_0_1         1         1
#>  2 female     5     0 F0_0_12        3         3
#>  3 female     5     0 F0_0_14        1         1
#>  4 female     5     0 F0_0_16        7         7
#>  5 female     5     0 F0_0_19        3         3
#>  6 female     5     0 F0_0_21        1         1
#>  7 female     5     0 F0_0_22        1         1
#>  8 female     5     0 F0_0_23        2         2
#>  9 female     5     0 F0_0_24       23        19
#> 10 female     5     0 F0_0_26        7         6
#> # ℹ 12,407 more rows

result$plot_mate_counts